CEPRES Portfolio Monitoring
See what is changing underneath your portfolio, before it reaches the headline numbers
- Find the companies and assets driving performance and risk.
- Track revenue, EBITDA, margins, leverage and valuation movement before stress reaches NAV.
- Separate genuine operational value creation from leverage and multiple expansion.
- Benchmark against raw GP-sourced data across 200,000+ PE-backed deals with full look-through.
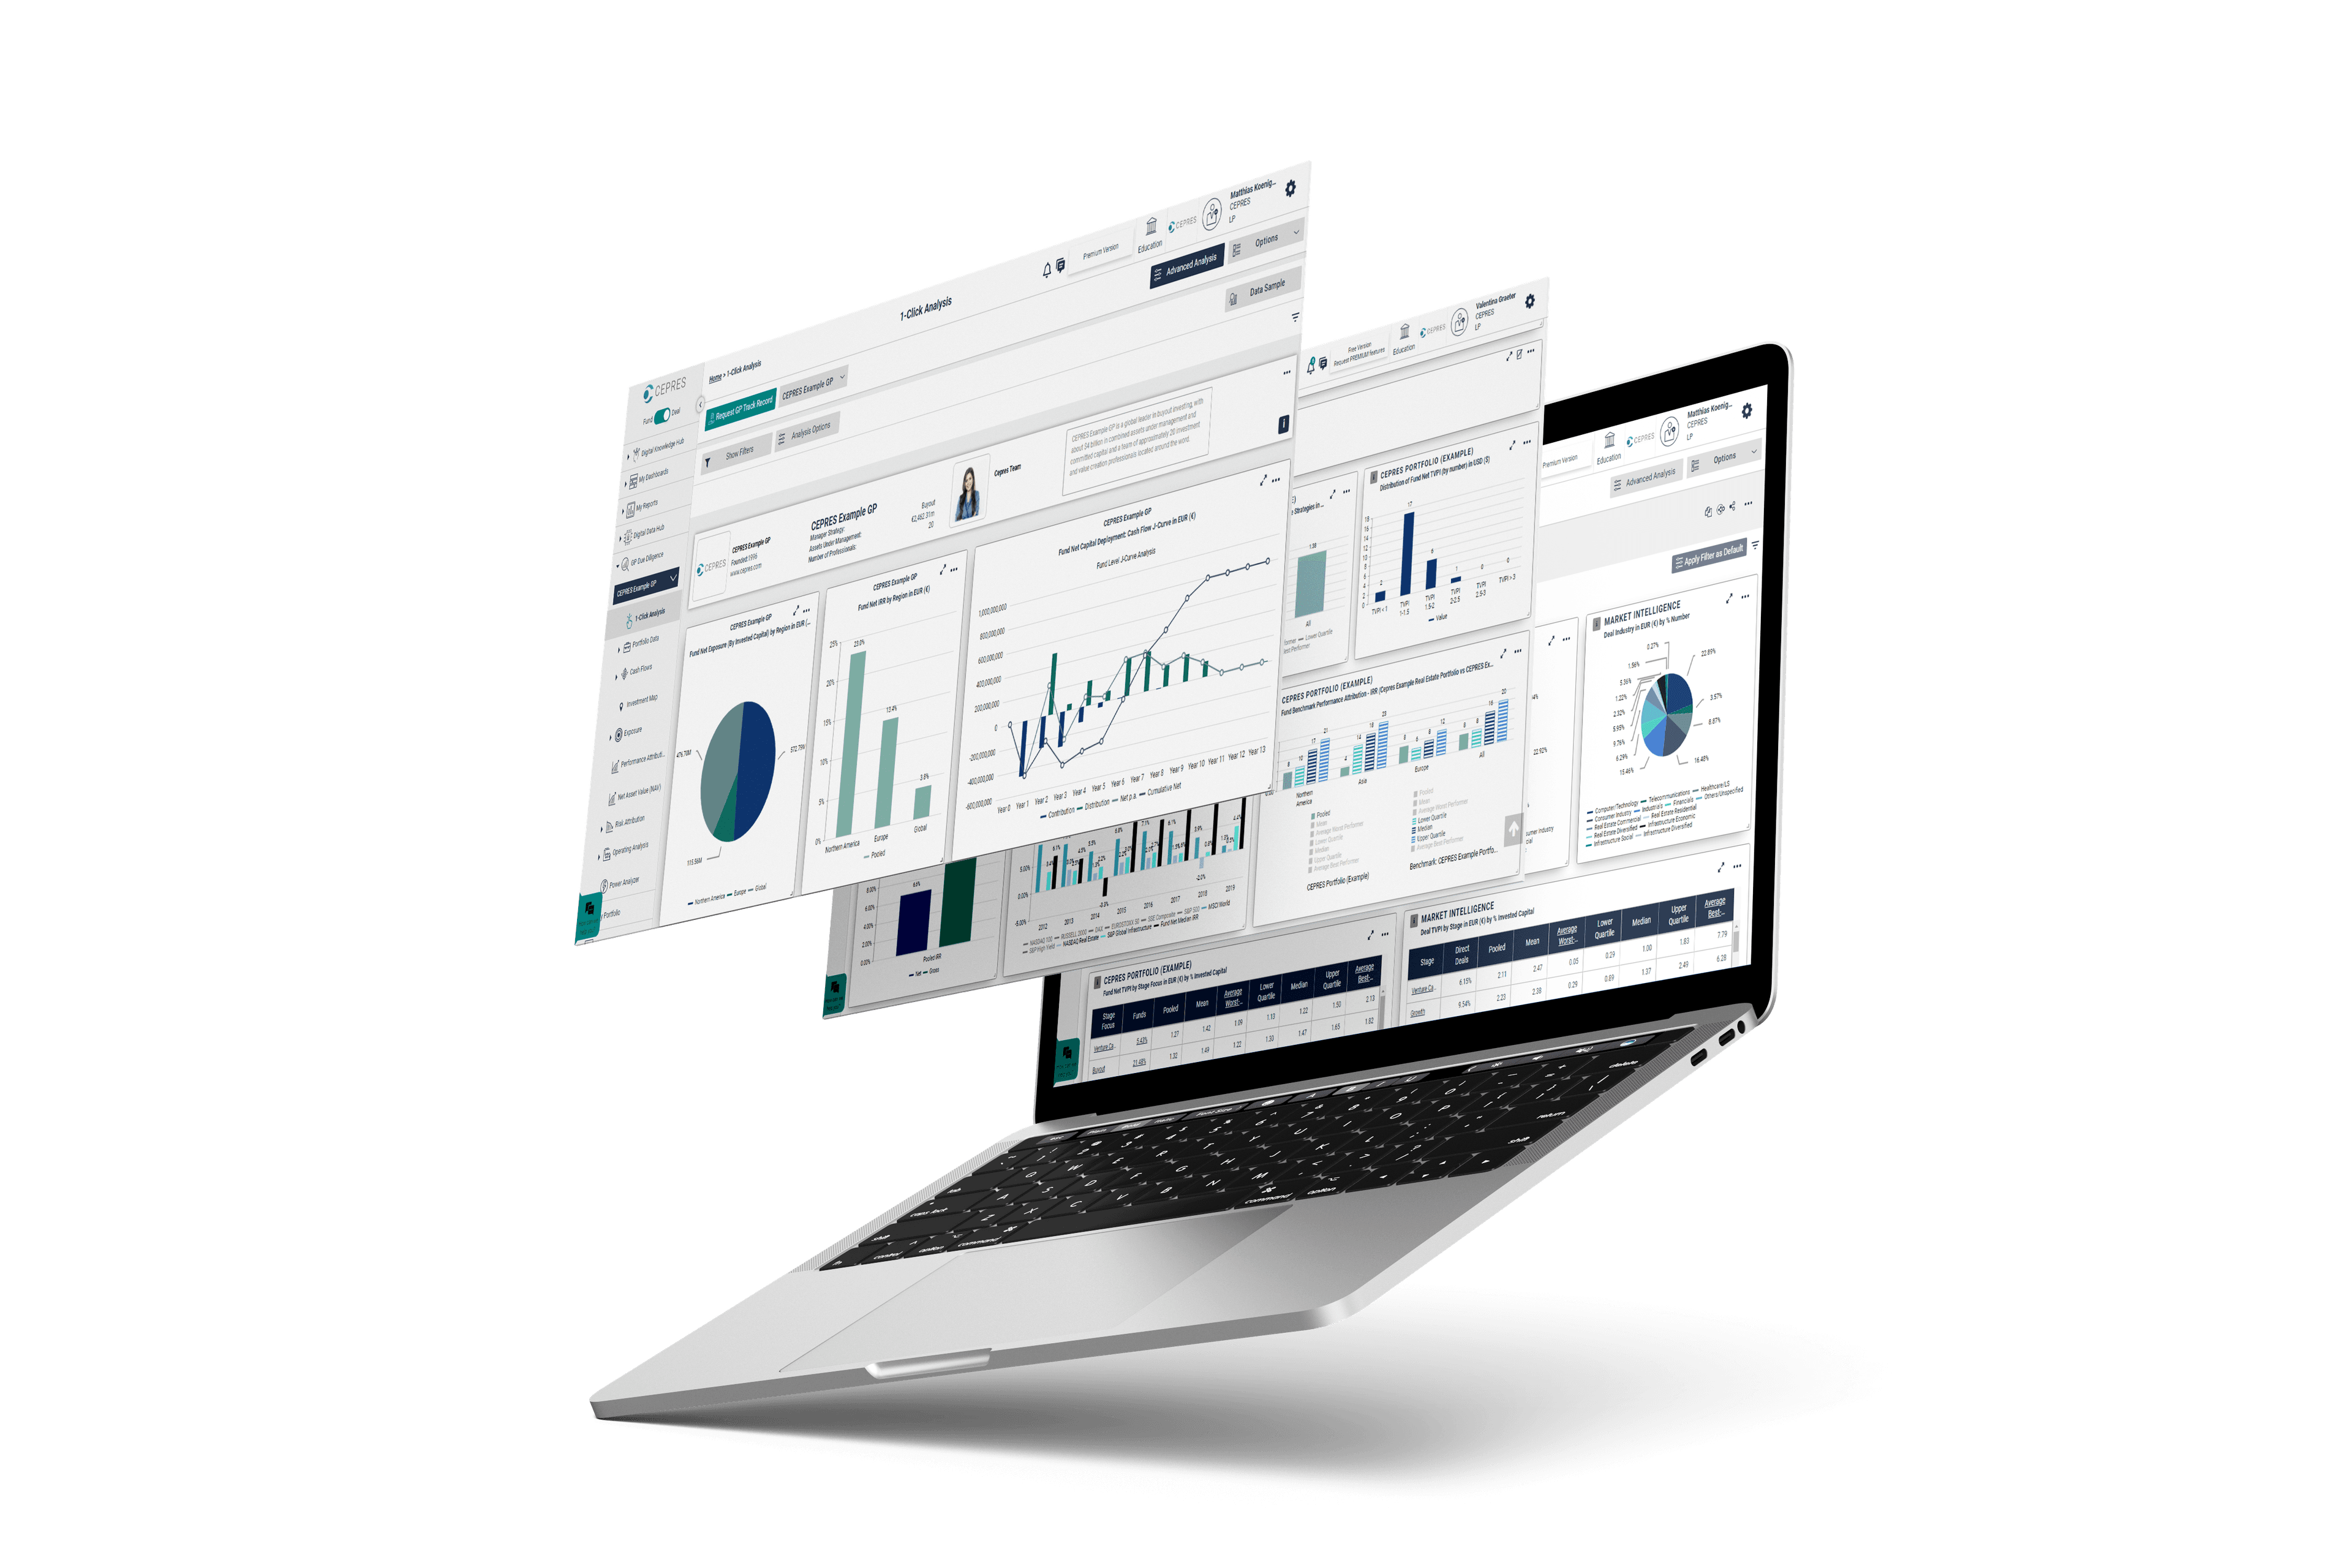
CEPRES Portfolio Monitoring provides the market leading Insights on your Portfolio due to accuracy and flexibility
A reported number tells you what happened. It does not always tell you why.
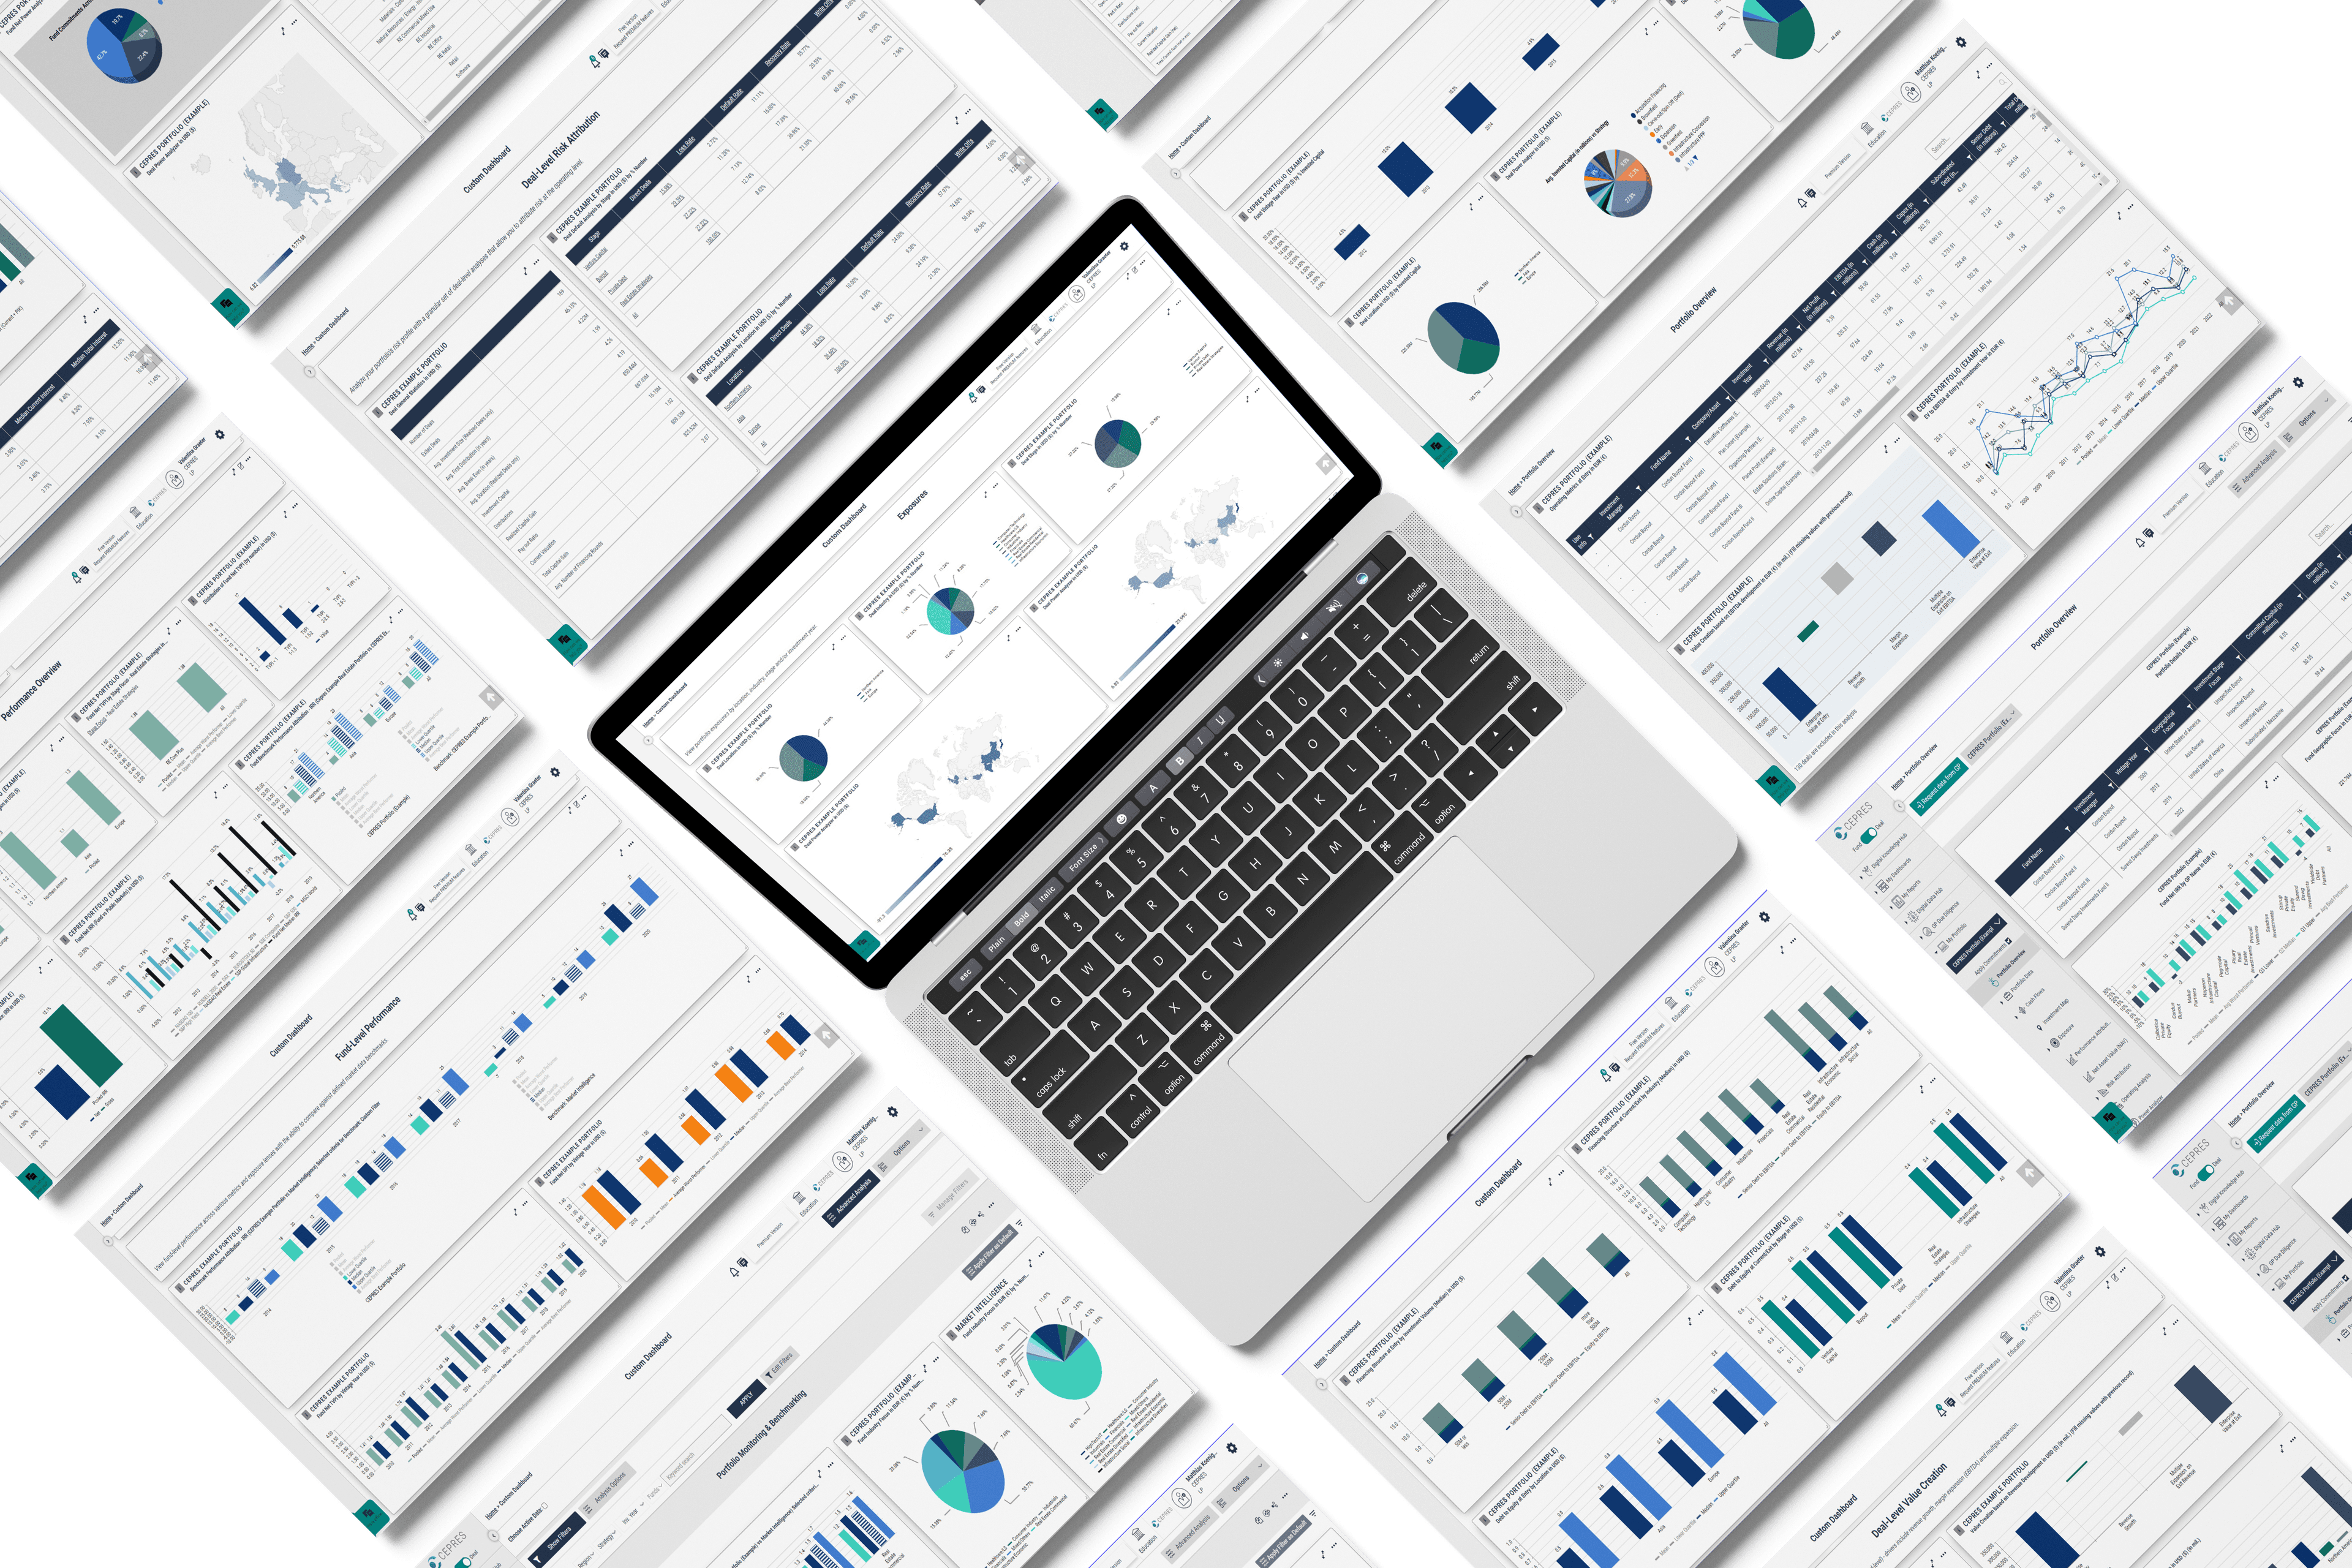
A fund can still look healthy while revenue slows, margins compress or leverage rises underneath.
Scraped PDFs, websites and FOIA disclosures can reproduce reported numbers, but they do not provide the same underlying evidence as raw fund and deal cash flows combined with portfolio-company operating data.
CEPRES is built on 2,254 legally contracted data contributors, giving you raw GP-sourced data to investigate what actually changed.
Which asset caused it? Did EBITDA fall? Did leverage rise? Did the valuation multiple move? Is the same pattern appearing elsewhere in the market?

Features

Find the investment behind the headline number
Move beneath the fund to identify the company, asset, co-investment or tranche responsible for the change.

See deterioration before it becomes a write-down
Track revenue, EBITDA, margins, cash, leverage, debt and valuation multiples to spot weakening operating performance earlier.

Know whether value creation is real
Separate revenue growth, margin expansion, financing changes and multiple movement to understand how returns were actually created.

Don’t benchmark against an incomplete market view
Compare funds, deals and underlying companies against GP-sourced evidence across returns, cash flows, NAV, margins, leverage and entry multiples.

Monitor the signals that matter for each strategy
Use revenue, EBITDA and leverage for buyout; coupons and PIK for private debt; and NOI, occupancy, DSCR and LTV for real assets.

Turn portfolio evidence into better decisions
Give investment, risk and IR teams the same underlying evidence for manager reviews, portfolio decisions, DDQs and investor conversations.
What is your portfolio telling you that your quarterly report isn’t?

The risk is not that deterioration never reaches the headline numbers. It is that you see it only after it does.
CEPRES helps you identify which assets are driving performance and risk, understand why, and judge whether the pattern is portfolio-specific or market-wide.
Bring us one question you cannot answer quickly enough today.
Which assets are driving risk? Is performance operational or valuation-led? Where is leverage building? What are we overlooking?
We’ll show you what the underlying data says.

CASE STUDY
How a $100B+ EMEA Asset Manager Scaled Portfolio Intelligence
Challenge: Fragmented data and slow reporting limited insight and decision-making across 500+ portfolio companies.
Solution: CEPRES provided an end-to-end platform for portfolio monitoring, benchmarking, and forecasting—delivering real-time insights, automated reporting, and seamless workflow integration.
Results: Reporting time dropped 60%, data consistency improved, and investment teams made faster, more confident decisions.
Ask the questions that matter with CEPRES AInsights II
AInsights II brings natural-language intelligence directly to Portfolio Monitoring.
Ask which funds or assets are driving risk, where operating performance is deteriorating, or what stands out against the market. AInsights II interrogates your portfolio data alongside CEPRES market intelligence to surface patterns, explain complex analysis and turn the findings into clear answers.
Use it to investigate risks, prepare board and investment committee reporting, answer DDQs and uncover insights you might otherwise miss — without manually working through charts, tables and reports.
Portfolio Management Solutions
Analysis Builder
Fully integrated Power BI with comprehensive data model enables unlimited analysis customization with no IT effort.
Fund Screener
Pipeline management and fast GP track record screening for data-driven investment decisions.
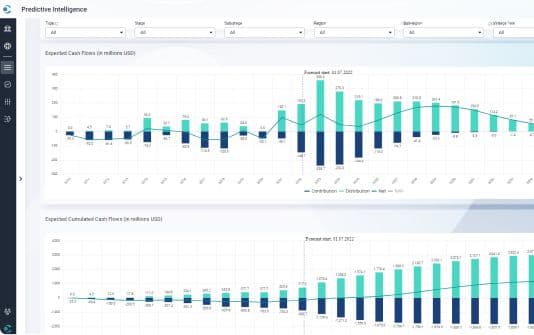
Predictive Intelligence
An AI-based cash pacing and commitment planning solution designed to forecast portfolio outcomes and improve asset allocation planning.
Due Diligence Software
Fast and customizable due diligence analysis with fund, deal, and operating-level benchmarking to enhance private equity due diligence process and underwriting decisions.
OUR LATEST CONTENT
Thought Leadership

02.06.2026 /
REPORT
The Repricing of Private Markets: 25 Years of Data on Valuations, Leverage and Returns
LPs cannot afford to rely on outdated assumptions.
Pricing has shifted. Leverage risk is rising. Returns are under pressure. In today’s volatile market, understanding where private markets have been repriced is critical to manager selection, underwriting, and portfolio risk.

26.05.2026 /
REPORT
How Deal Comps Can Help Uncover Hidden Opportunities and Avoid Costly Mistakes
This report uses granular Deal Comps from CEPRES DealForge to reveal two very different healthcare subsector stories: cosmetic dental implants, where median gross IRR reaches 21.8% with ~10.1x entry EV/EBITDA, and mental care facilities, where nearly one-third of deals fall below 1.0x MOIC.
Download the report
15.02.2026 /
REPORT
CEPRES' 2026 Private Credit Outlook
Get a data-driven view of the trends shaping private credit in 2026 — from widening performance dispersion and sector-level risk to refinancing pressure and borrower resilience. Built on CEPRES private markets data across 17,200+ funds and 157,000+ deals, this report helps investors move beyond headline market narratives and understand what is really driving outcomes at the loan level.
Download the report
26.05.2025 /
ONE PAGER
CEPRES AInsights: Transforming Private Capital Markets
As private capital markets become increasingly complex, leveraging data-driven decision-making is essential for staying ahead and making informed investment choices. Find out how CEPRES AInsights helps LPs and GPs to extract meaningful insights quickly and efficiently.
Download the one-pagerEager to improve your decision making?
Contact our Experts and experience how CEPRES can help you
CEPRES is the leading private market investment data platform. Start unlocking better investment outcomes.- Optimize portfolio monitoring for greater efficiency and insights
- Enhance the depth and precision of performance analysis via real market data
- Identify and assess potential investment opportunities
- Access the world’s most comprehensive private markets data ecosystem
Request a Demo
Frequently asked questions
Portfolio tracking software helps private equity investors monitor fund performance, capital flows, and portfolio company metrics in real time. It enables accurate investment portfolio tracking, ensuring that investors have a clear view of cash flows, valuation changes, and returns. With tools like CEPRES Portfolio Monitoring, investors gain access to high-quality private equity portfolio management software that enhances transparency and decision-making.