MARKET DATA
Market Intelligence
Empowers investors with unparalleled accuracy and transparency into private market data and insights.

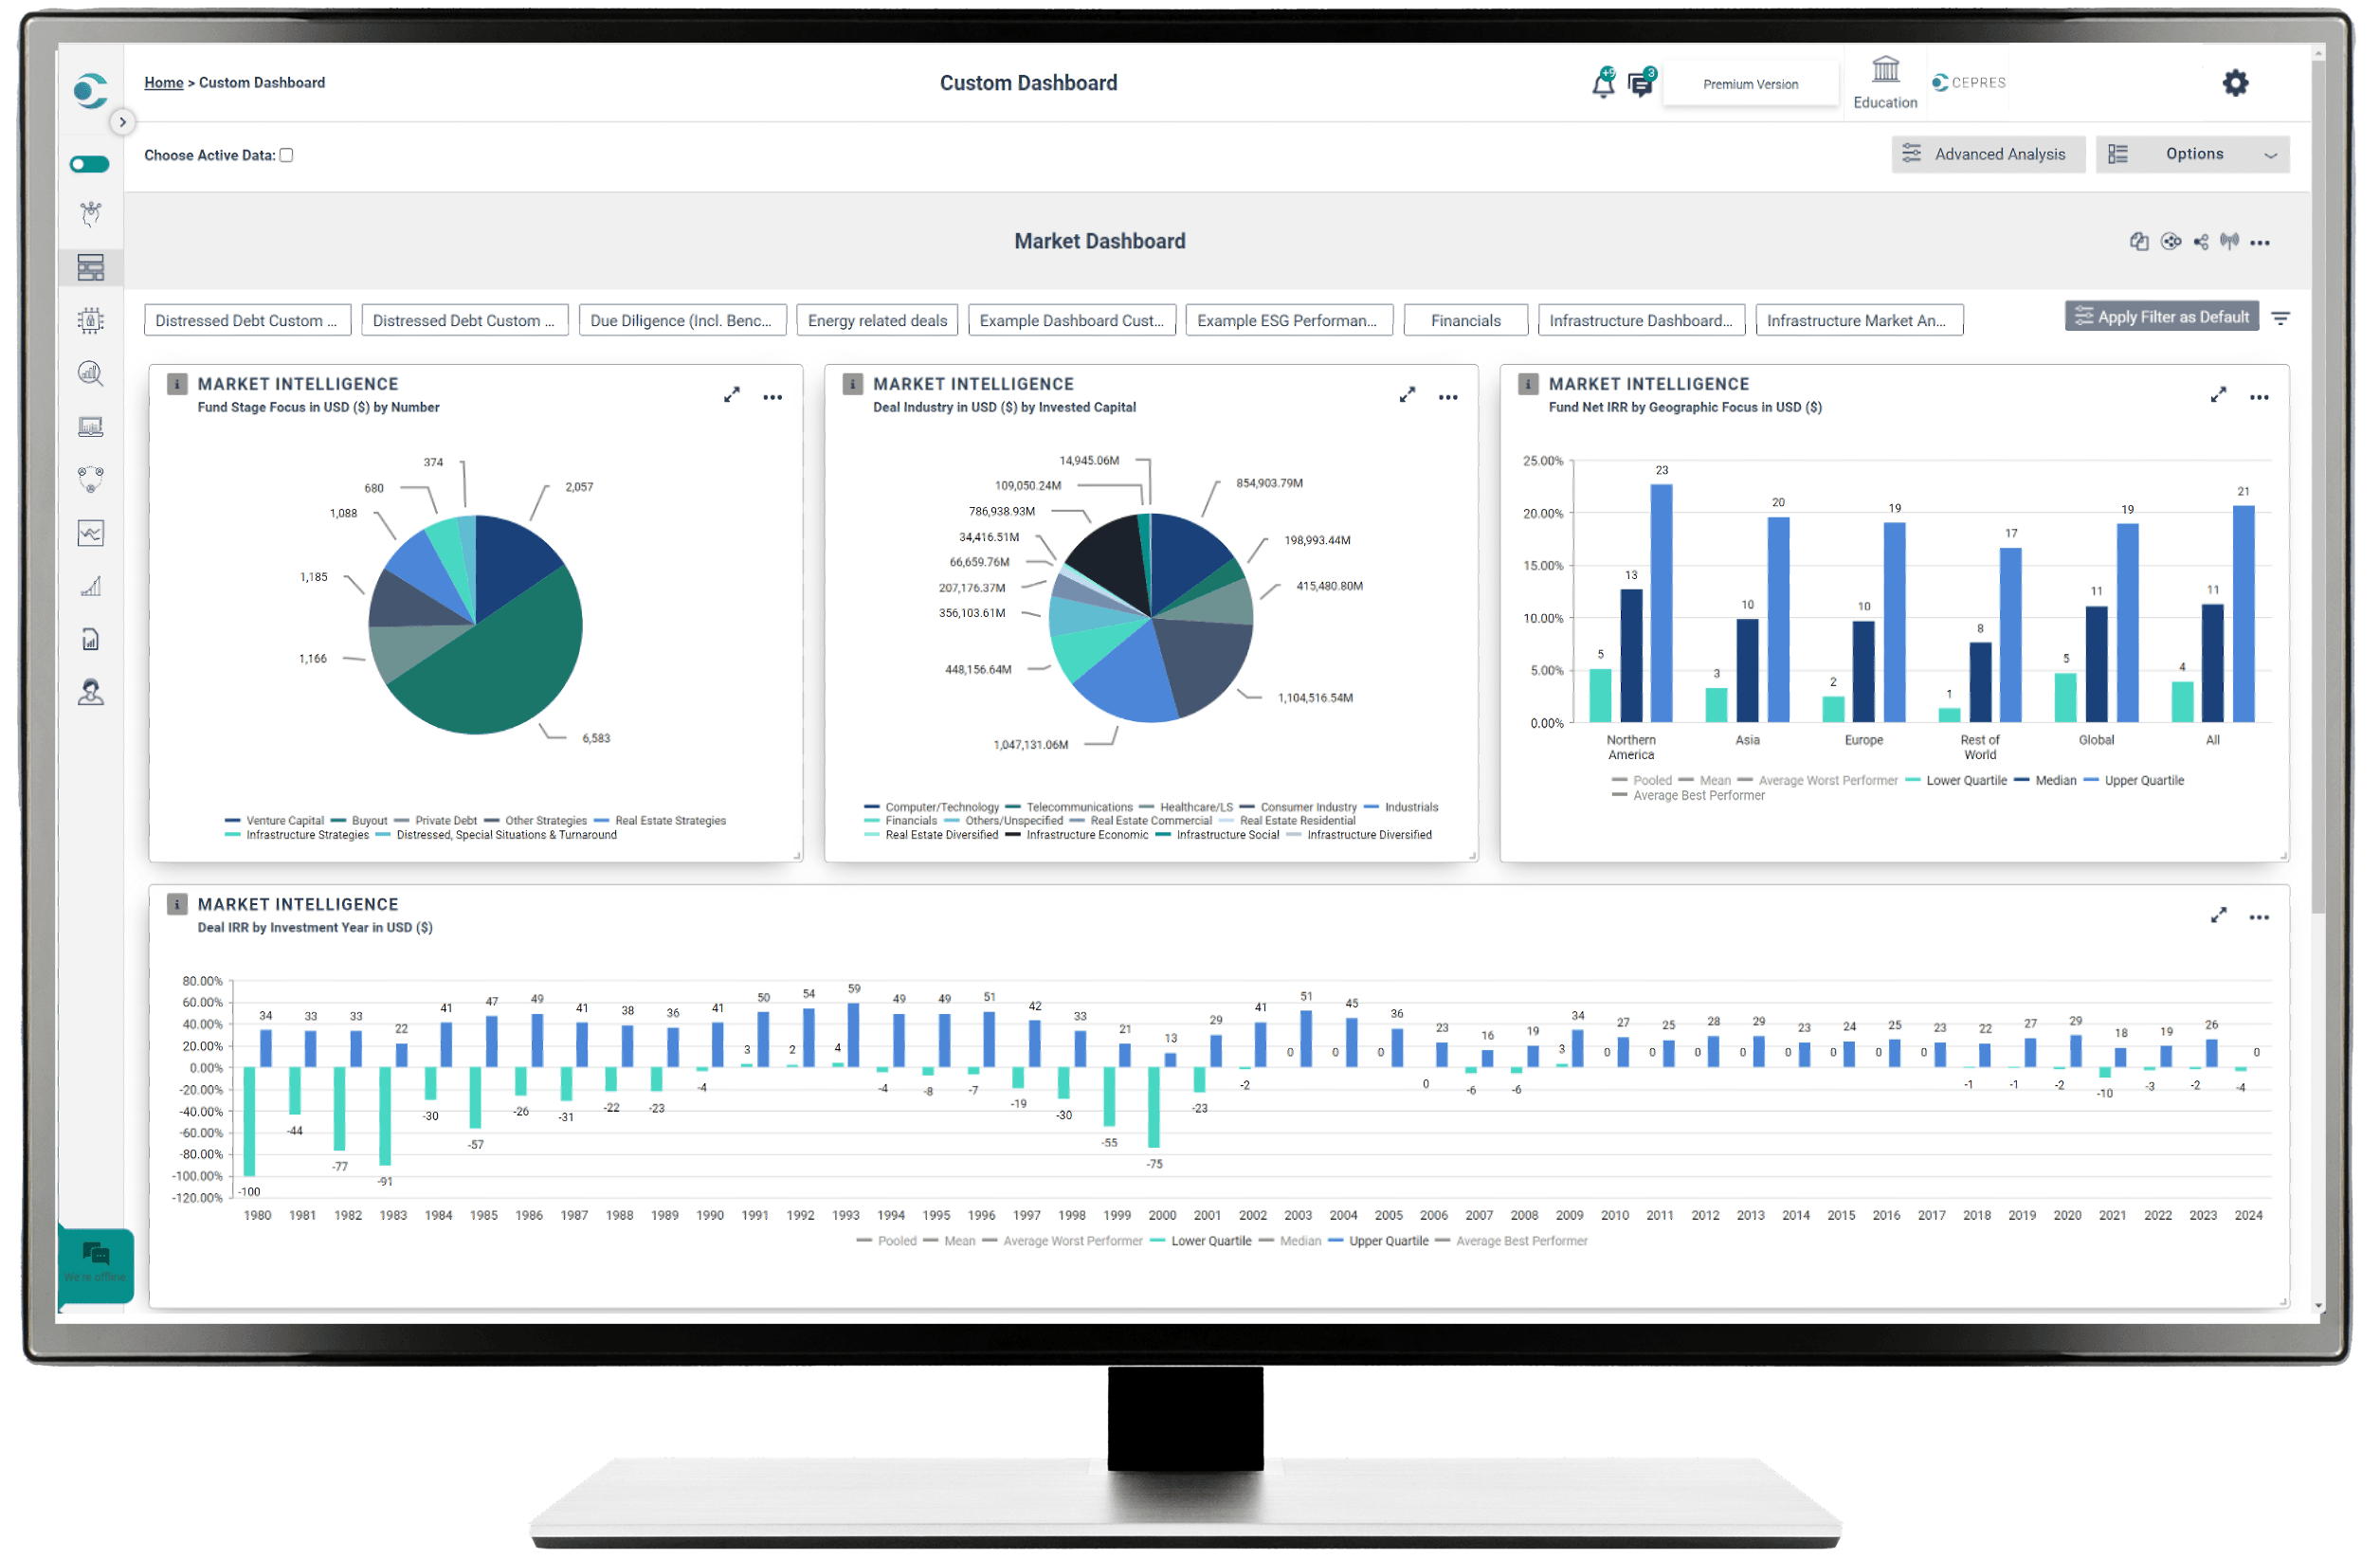

Your Single Source of Truth in Private Market Investing
Unlock the full potential of your investment strategy with CEPRES Market Intelligence, the premier platform for private market data and insights. Whether you're analyzing fund, direct, or operating company performance, CEPRES provides everything you need to support your stakeholders and make data-driven decisions.
Access insights from over 13,000 funds and 130,000 portfolio companies, enabling you to prove your investment thesis, develop portfolio strategies, and mitigate systematic risks with confidence.
CEPRES works directly with GPs to source the data you need to meet your portfolio goals. We verify every data point, down to individual operating cash flows, ensuring that 100% of your data is accurate, actionable and governed.
With more than 13,000 funds and 1,000,000 cash flows, CEPRES provides the most accurate, actionable private market data.
Leverage 50+ years of portfolio company cash flow performance as empirical evidence to make more informed investment decisions.
Comprehensive Analysis
Measure a GP's track record or benchmark your portfolio's performance against broader private and public markets. Move beyond traditional benchmarking by comparing your performance against real marketplace metrics, such as IRR, MOIC, alpha, TVPI, and operational KPIs like revenue CAGR and EBITDA growth. CEPRES empowers you to create, test, and refine your investment strategies, accelerating your impact in an increasingly complex private market landscape. Some types of analysis you can conduct with CEPRES Market Intelligence:


Market Intelligence Solutions
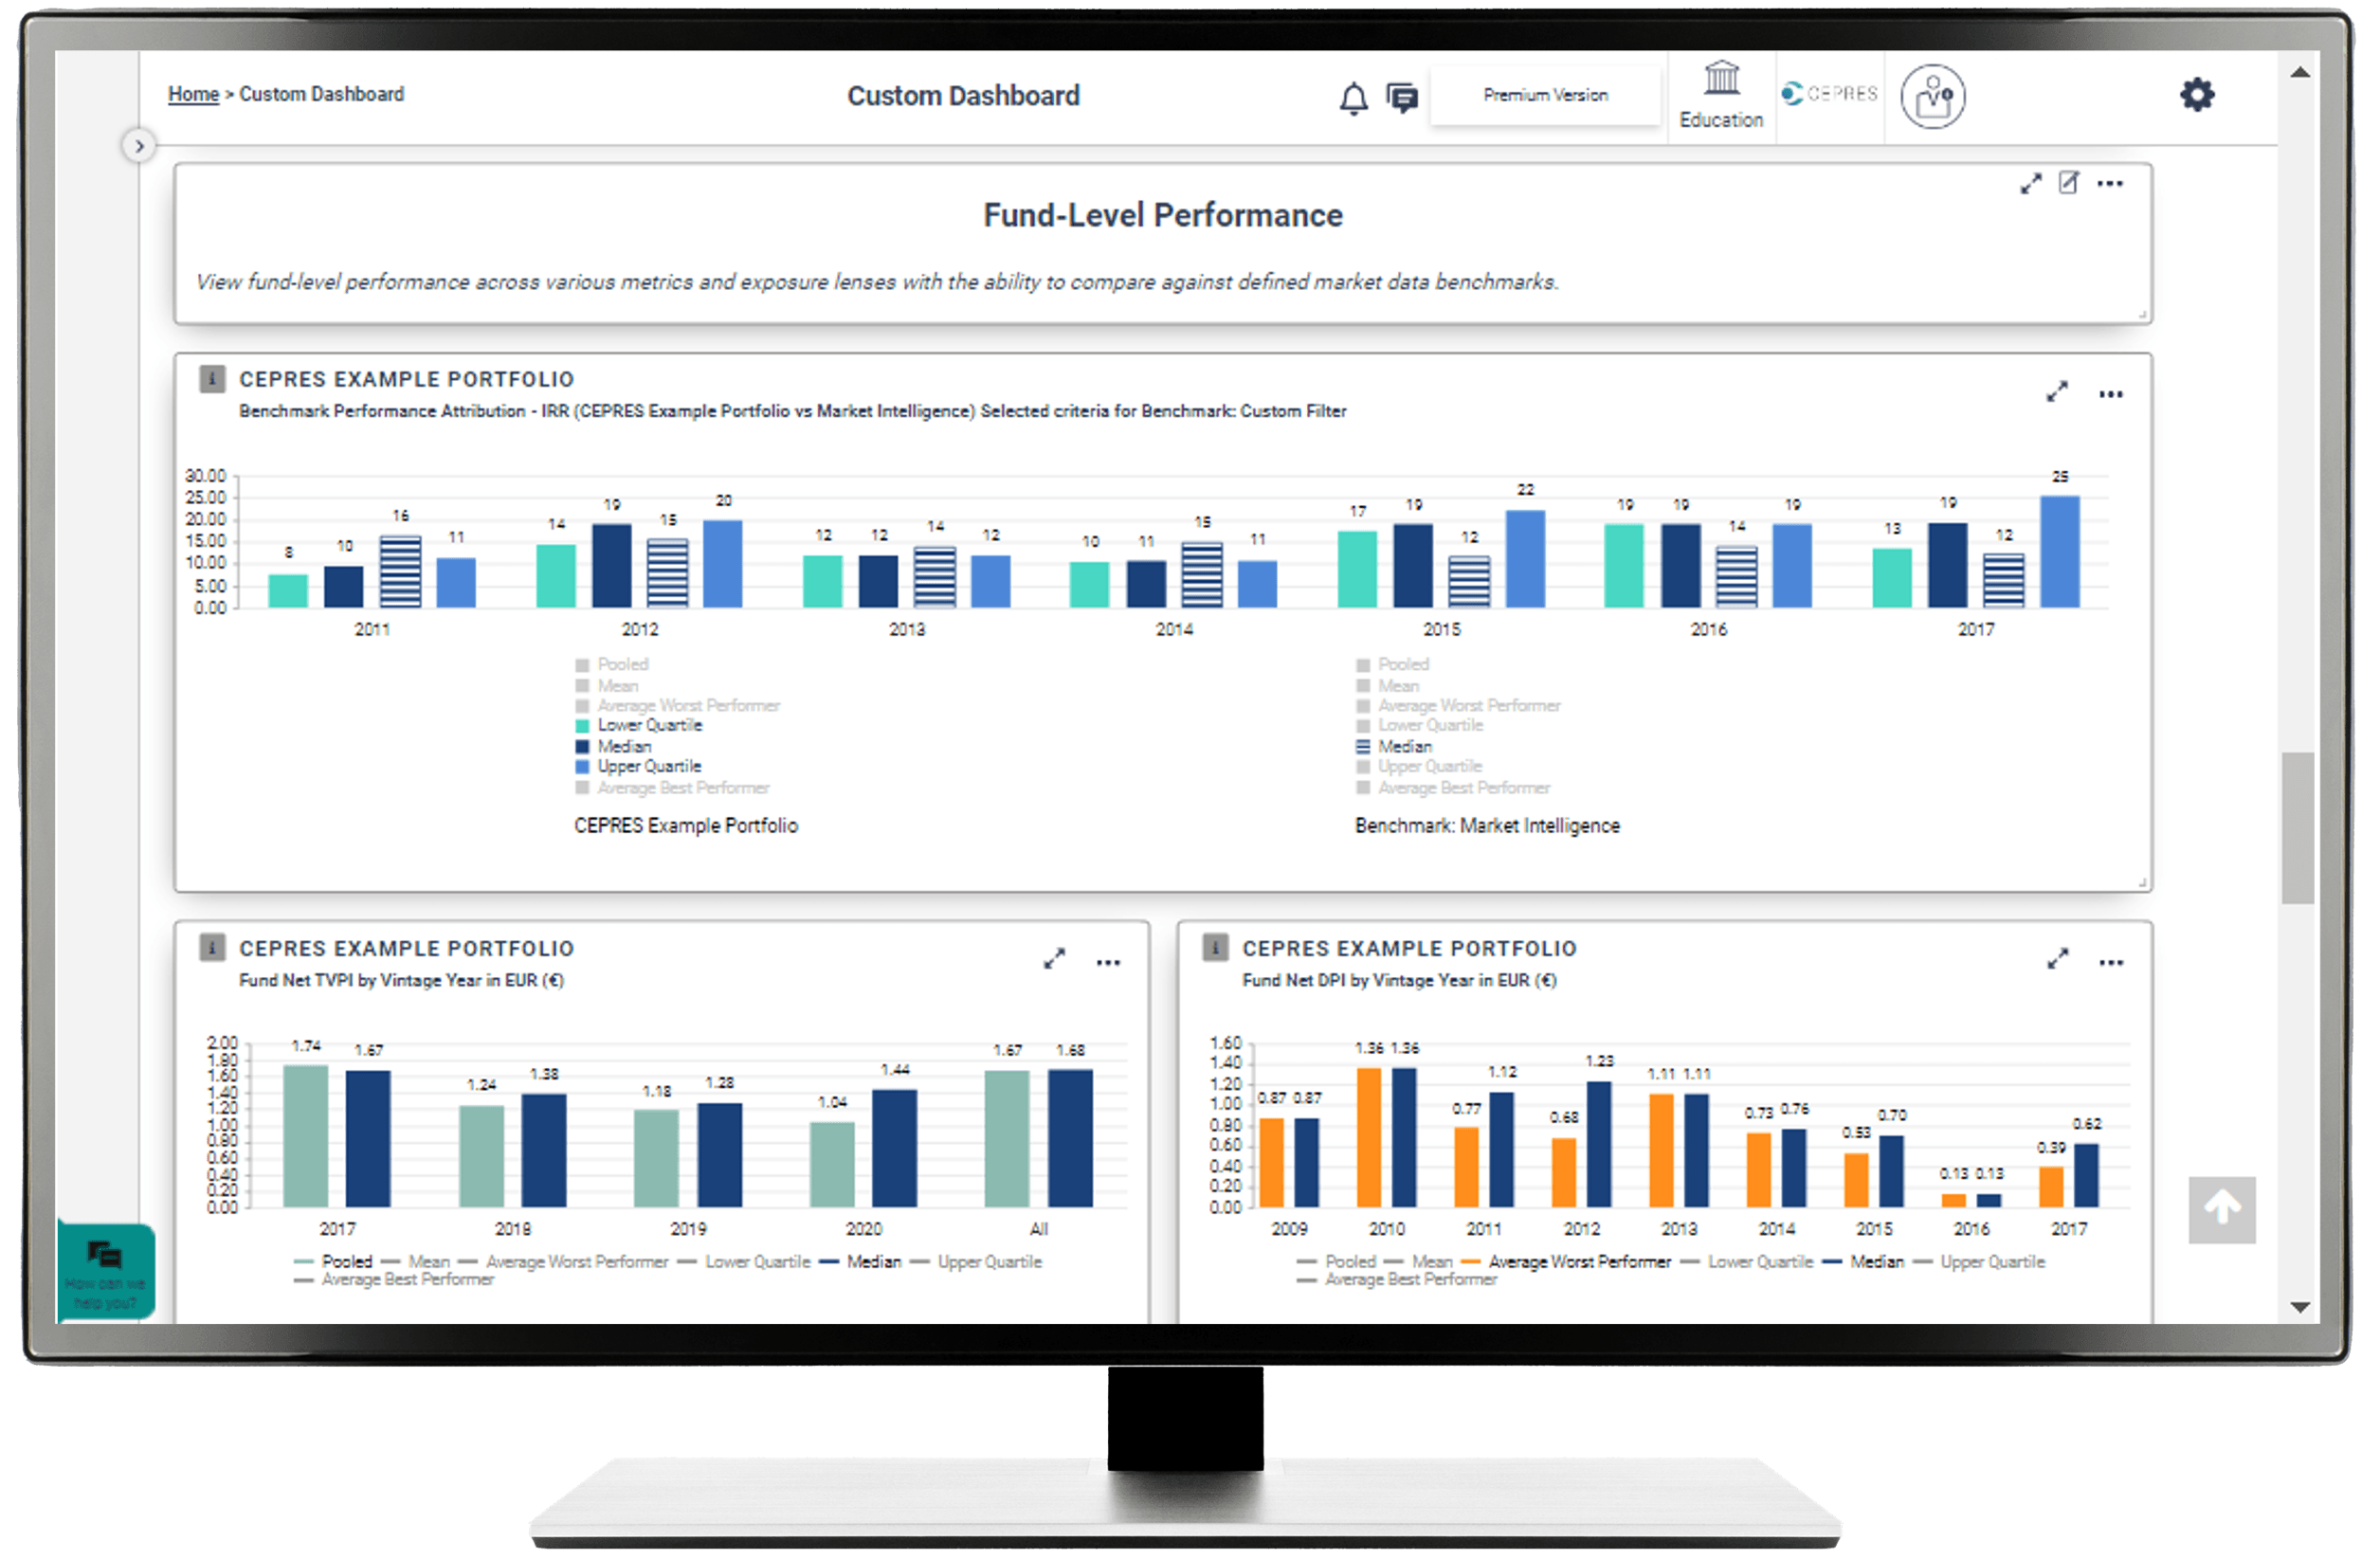
Benchmarking
Accurate, verified GP cash flow analysis at the fund and deal level for deeper insights into the true drivers of portfolio risk, return, and value
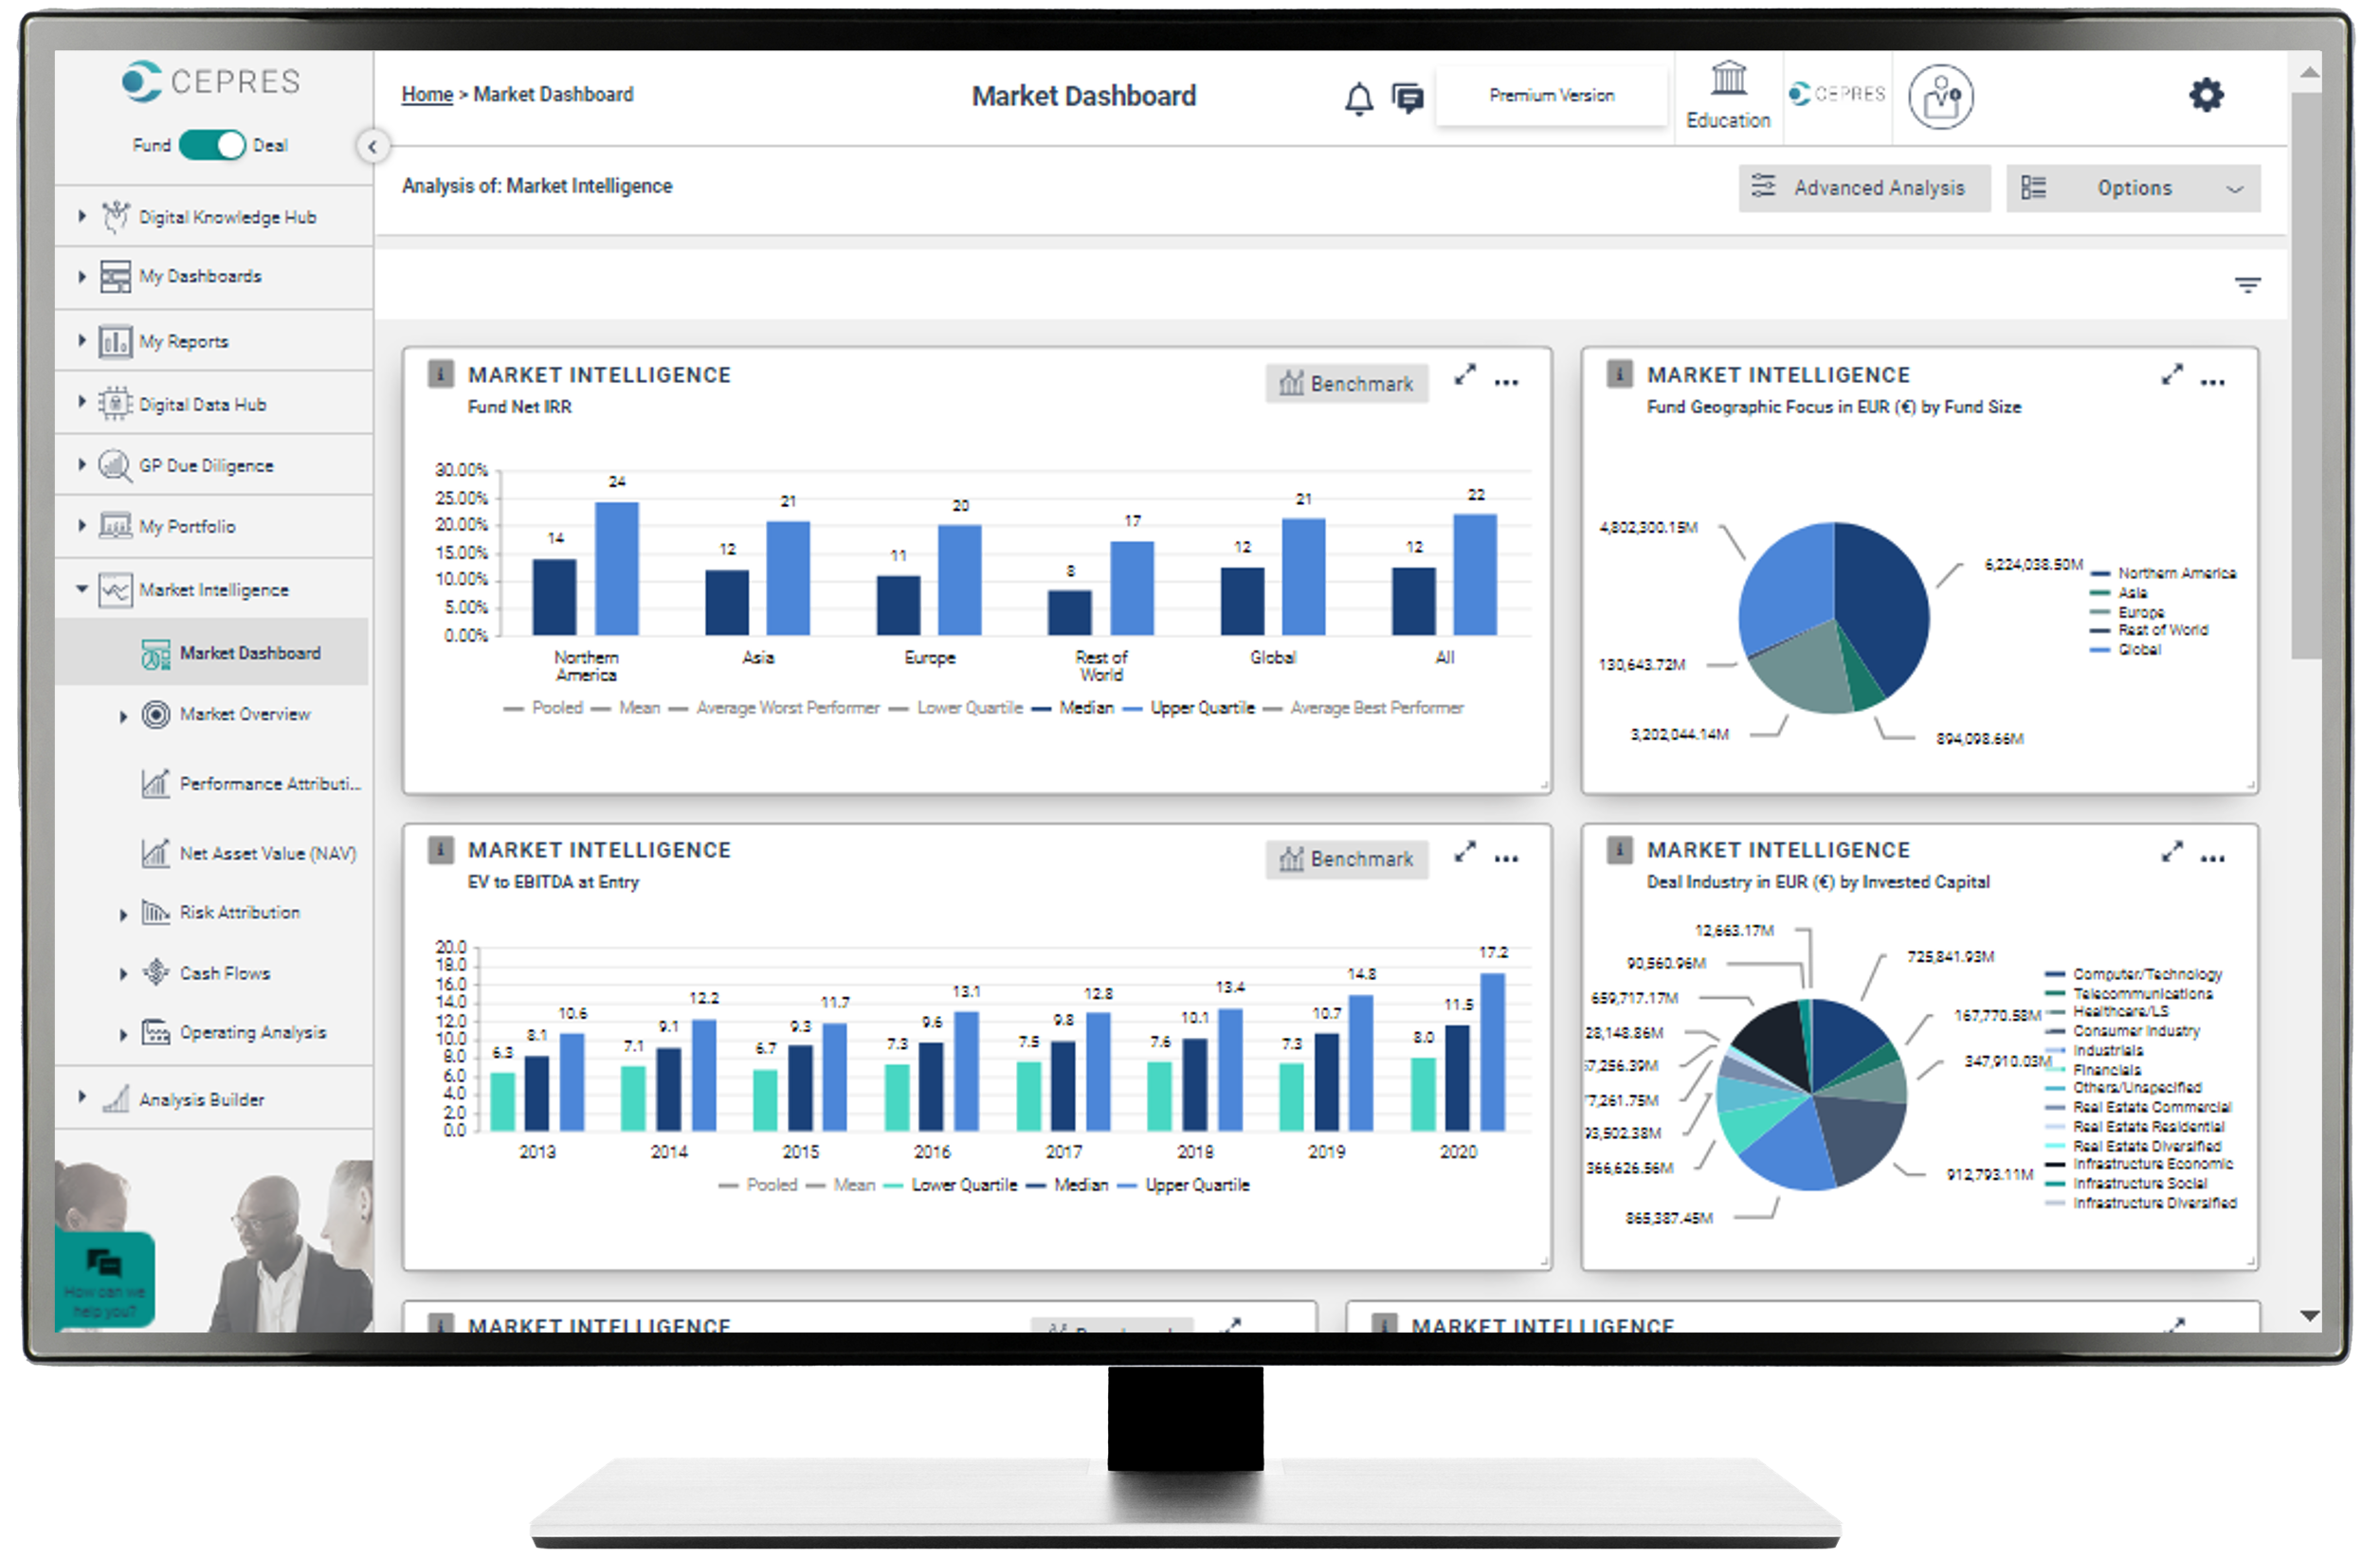
Market Research
Customized analysis to research and model private market investment strategies
Benchmarking
Accurate, verified GP cash flow analysis at the fund and deal level for deeper insights into the true drivers of portfolio risk, return, and value
Market Research
Customized analysis to research and model private market investment strategies

Featured Content
The PE industry has grown rapidly over the last two decades, recording an extraordinary increase in funds raised, fund size, deal volume, and overall deal size. But a perennial challenge – illiquidity – has remained largely unresolved, until now.
The Solactive CEPRES US Private Equity Industry Replicator Index is a new approach that provides return exposure to the return profile of buyout funds focused on North America.
This new replication approach, based on reweighting publicly listed equities, can deliver a similar performance to the North American private equity sector.
Insights

The Data Center Deal: What the Numbers Actually say About the AI Infrastructure Boom
Data Centers are commanding some of the highest valuations in private markets. But the headline returns hide a much more divided market.
CEPRES DealForge shows recent Co-location/Data Center deals at 20.60x median EV/EBITDA, while the upper 50% generated a 44.16% median IRR versus 11.58% for the lower 50%.
Download the report to see what separates the strongest deals, where sector averages mask downside, and what is actually driving returns — before your next investment decision.

Venture Capital: Is the AI Boom Repeating the Dot-Com Cycle
Thirty years of North American technology venture data reveal a $480.5bn gap between reported portfolio valuations and realized cash.
Download the report to compare the AI and dot-com cycles across capital flows, defaults, loss rates, IRR and DPI—and see what the data suggests about how much of today’s AI-driven value could ultimately convert into distributions.

Price and Limits of the EV Trade: A Deal-Level View of Growth, Risk, and Returns in Automotive Components
DealForge analysis of 112 automotive-component investments, including 18 tire and rubber deals, reveals a 23.73% versus 0.41% median gross IRR split — while 85% of net equity value creation came from revenue growth and margin expansion.
The Data Center Deal: What the Numbers Actually say About the AI Infrastructure Boom
Data Centers are commanding some of the highest valuations in private markets. But the headline returns hide a much more divided market.
CEPRES DealForge shows recent Co-location/Data Center deals at 20.60x median EV/EBITDA, while the upper 50% generated a 44.16% median IRR versus 11.58% for the lower 50%.
Download the report to see what separates the strongest deals, where sector averages mask downside, and what is actually driving returns — before your next investment decision.
Venture Capital: Is the AI Boom Repeating the Dot-Com Cycle
Thirty years of North American technology venture data reveal a $480.5bn gap between reported portfolio valuations and realized cash.
Download the report to compare the AI and dot-com cycles across capital flows, defaults, loss rates, IRR and DPI—and see what the data suggests about how much of today’s AI-driven value could ultimately convert into distributions.
Price and Limits of the EV Trade: A Deal-Level View of Growth, Risk, and Returns in Automotive Components
DealForge analysis of 112 automotive-component investments, including 18 tire and rubber deals, reveals a 23.73% versus 0.41% median gross IRR split — while 85% of net equity value creation came from revenue growth and margin expansion.